

Multifocal procedures to correct presbyopia include corneal inlays, presbyopic LASIK, and a number of multifocal IOL models.1 One of the most important considerations for the clinician deciding which of these treatments to select for a presbyopic patient is the potential for postoperative visual performance. A new way of measuring optical performance and a new app may make it easier for researchers and clinicians to determine the optical qualities and performance of multifocal IOLs.
AT A GLANCE
• A new way of measuring optical performance and a new app may make it easier for researchers and clinicians to determine the optical qualities and performance of multifocal IOLs.
• Multifocal IOL technologies do not differ much in their basic principles, but they do differ in the ways that they divide light.
• The aim of the Qvision Multifocal Lens Analyzer app is to improve the agreement between how optical quality is described in the lab and how visual performance is measured in the clinic.
Multifocal IOL technologies do not differ much in their basic principles, but they do differ in the ways that they divide light. For example, diffractive multifocal IOLs are configured to split light energy into two or three foci, depending on whether they are bi- or trifocal. This means that less light is directed to each focus as the number of foci is increased. This is easily seen in the laboratory by measuring the through-focus response (TFR) for a single spatial frequency on an optical bench.2 For the benefit of readers who are not familiar with this type of measurement of optical quality, a brief explanation follows.
MTF AND TFR
The optical quality of any optical device is characterized by its ability to reproduce an object as accurately as possible in a corresponding image once light travels through the device. The object to be reproduced can be square gratings of periodic dark and bright bars, and the structure corresponding to one bright bar and one black bar is called one cycle or line pair (LP; Figure 1). Depending on the number of LPs contained in a millimeter of distance (LP/mm), it is said that the frequency of the object is higher as the LP/mm increase and lower as they decrease.2
For an ideal optical system, it is expected that the light intensity of dark bars (minimum luminance [Lmin]) and bright bars (maximum luminance [Lmax]) should be maintained in the projected image. This is a perfect situation that does not happen in the real world, however, because lenses are affected by imperfections that produce aberrations, leading to diminution of optical quality.
The difference in luminance between dark and bright bars is called modulation or contrast, and it is computed by the equation of Michelson. If the modulation of a wide range of frequencies is measured, it can be represented by a 2-D function called the modulation transfer function (MTF). This function gives information about how a given IOL modulates contrast, but only for a single specific focus. Therefore, an alternative method is needed to characterize multifocal IOLs.
The solution to this problem is to use a single spatial frequency and move the object in a range of positions that contains all the foci of the lens in the conjugate image space. The result of this is the TFR (Figure 2). MTF and TFR are commonly used by manufacturers in order to describe the optical quality of their lenses to ophthalmologists.
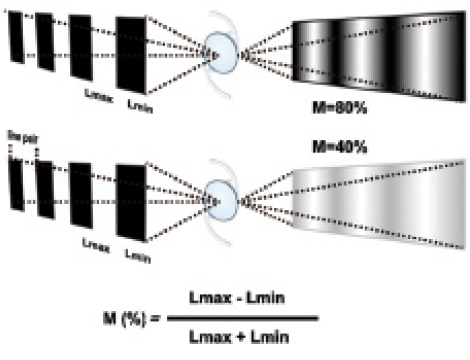
Figure 1. IOLs tested with square gratings. The top IOL reproduces the object at the image with higher modulation than the bottom IOL. Square gratings appear like sinusoidal gratings at the image because of aberrations in the IOLs. The equation of Michelson describes how modulation is computed.
VISUAL PERFORMANCE, DEFOCUS CURVES
Regardless of whether MTF or TFR is used to describe the optical quality of an IOL, it is important to note that both metrics are based on the variation of contrast produced by the IOL: at one focus and many frequencies (MTF) or at many foci and one frequency (TFR).
Why, therefore, do we use a resolution task—visual acuity (VA)—to measure defocus curves (DC) when clinical results of multifocal IOLs are reported? It is widely known that contrast sensitivity (CS) is more sensitive to small changes in optical quality than VA.3 Therefore, researchers use CS in studies with multifocal IOLs.4 It must be considered, however, that CS as measured in these studies generally provides information about only one position (distance vision), and some evaluations may fail in the assessment of best focus position if the vergence at the distance at which the test is presented is not corrected by positive lenses. In order to address this issue, we propose that a new method to measure DC based on CS, like TFR, is used in the laboratory.
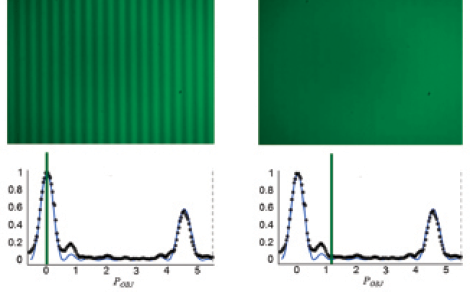
Figure 2. Through-focus response testing of a multifocal IOL for monochromatic light at 560 nm. The image of a square grating is shown (top) at two positions of the object (vergences). The vertical lines in the graphs (bottom) represent the modulation at these positions.
NEW WAY OF MEASURING DEFOCUS CURVES
For the purpose of achieving better agreement between TFR in the lab and DC in the clinics, M. Rodriguez-Vallejo has designed and programmed an app for the iPad (Apple), the Qvision Multifocal Lens Analyzer. This app has the capability to measure DC based on resolution (VA defocus curve; VADC) or detection (CS defocus curve; CSDC).
For both options for measuring DC, a psychophysical staircase method is implemented to achieve the threshold. This makes the measurement independent of the examiner because all that is required is to press a button corresponding to an answer given by the observer. An automated method decides when the trial is finished, and, thus, inter-experimenter bias is eliminated. This method has been shown to provide better reliability than conventional charts.5
The procedure is simple. The iPad is located 2 m from the patient, and a 0.50 D lens is inserted in the trial spectacle to correct the vergence distance. The test is begun, and a message appears on the screen telling the experimenter what defocus lens to put over the trial spectacle. With each correct answer from the patient, the optotype is decreased in size (for VADC) or contrast (for CSDC). Conversely, if the patient fails in the correct orientation of the Snellen E presented on the screen, the size or contrast is increased until the patient provides the correct answer again. The change in direction of size or contrast is named reversal or career, and two procedures have been implemented, fast or precise, depending on the number of careers. Once the threshold is achieved for a particular lens, an alert appears on the screen to replace the current lens with another with 0.50 D less power. The process continues until the last lens from the range of the DC is reached (-4.00 D).6
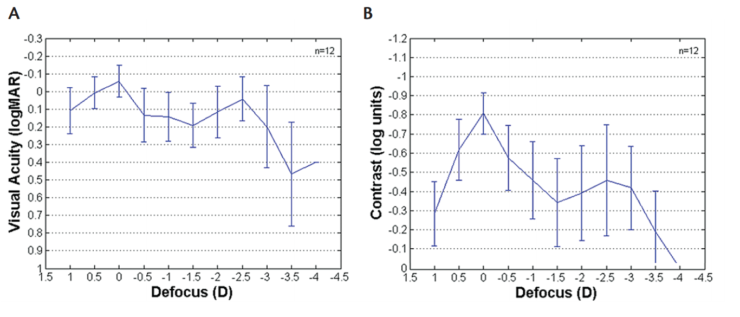
Figure 3. VADC (A) and CSDC (B) in a sample of 12 eyes of 12 patients implanted with a trifocal IOL. Although there is little difference (~0.1 logMAR) in terms of mean VA at distance (0 D) and near (-2.50 D), mean CS shows greater variation in visual performance between distance and near (~3.5 log units).
PERFECT SOLUTION
This new tool for measuring DC is a perfect solution for research and clinical purposes for a number of reasons.
Reason No. 1: Standardization. The iPad is a universal device. Furthermore, as the experimenter does not decide the threshold, it is expected that results obtained at various centers by different experimenters with the same multifocal IOL will be more uniform than if they used different tests or if the experimenter determined at which level of VA or CS to end a trial.5
Reason No. 2: Remote database connection. Data can be automatically sent to a common database so that high numbers of samples can be obtained in collaborative research studies at multiple centers.
Reason No. 3: More sensitive to changes in optical quality. VADC can be measured from 1.0 to -0.2 logMAR in 0.1 logMAR steps, whereas CSDC can be measured from 0 to -1.3 log units of contrast (Figure 3). CSDC offers the advantage of determining more precise differences in the optical quality.3 Therefore, it might be more adequate for assessing visual performance obtained with different multifocal IOLs, especially for the lenses that promise enhancing contrast sensitivity. To improve the capabilities of the iPad for reproducing low contrasts, the BitStealing technique for expanding the contrast levels in 8-bit devices is applied.7,8
CONCLUSION
VADC does not completely represent the visual performance obtained with multifocal IOLs. In fact, optical performance in the lab is measured with optical bench tests that describe the performance of the lens in terms of contrast for a particular spatial frequency along a wide range of vergences. The aim of this new app is to improve the agreement between how optical quality is described in the lab and how visual performance is measured in the clinic. This tool could improve the understanding of the difference of visual performance obtained with new IOLs that promise to improve CS.
The authors thank the Diffractive Optics Group at the University of Valencia (http://diog.webs.upv.es/) and especially Laura Remon for sharing some of the figures used in this article.
Financial interest disclosure: The app described herein is distributed for free by the Apple store under the name Qvision Multifocal Lens Analyzer. To obtain access to the private area for research purposes, please contact the authors. This app has been used with multifocal contact lenses by the Diffractive Optics Group at the University of Valencia, Spain, and with multifocal IOLs at Qvision in Almería, Spain.
1. Charman WN. Developments in the correction of presbyopia II: surgical approaches. Ophthalmic Physiol Opt. 2014;34(4):397-426.
2. ISO-11979-2:2014. Ophthalmic implants—Intraocular lenses—Part 2: Optical properties and test methods. 2014-08-15:22. http://www.iso.org/iso/iso_catalogue/catalogue_tc/catalogue_detail.htm?csnumber=55682. Date accessed: January 19, 2016.
3. Rabin J. Optical defocus: differential effects on size and contrast letter recognition thresholds. Invest Ophthalmol Vis Sci. 1994;35(2):646-648.
4. Montés-Micó R, Alió JL. Distance and near contrast sensitivity function after multifocal intraocular lens implantation. J Cataract Refract Surg. 2003;29(4):703-711.
5. Rodríguez-Vallejo M, Remón L, Monsoriu JA, Furlan WD. Designing a new test for contrast sensitivity function measurement with iPad. J Optom. 2015;08(2):101-108.
6. Wolffsohn JS, Jinabhai AN, Kingsnorth A, et al. Exploring the optimum step size for defocus curves. J Cataract Refract Surg. 2013;39(6):873-880.
7. Dorr M, Lesmes LA, Lu ZL, Bex PJ. Rapid and reliable assessment of the contrast sensitivity function on an iPad. Invest Opthalmol Vis Sci. 2013;54(12):7266-7273.
8. Kollbaum PS, Jansen ME, Kollbaum EJ, Bullimore MA. Validation of an iPad test of letter contrast sensitivity. Optom Vis Sci. 2014;91(3):291-296.
Joaquin Fernández, MD
• Medical Director, Qvision, Almería, Spain
• joaquinfernandezoft@qvision.es
Manuel Rodríguez-Vallejo, MSc
• Research Manager, Qvision, Almería, Spain
• manuelrodriguezid@qvision.es
Javier Martínez, OD
• Clinic Manager, QVision, Almería, Spain
• javiermartinezopt@qvision.es