
In September 2022, a group of eye care providers gathered at the 18th International Myopia Conference (IMC) in Rotterdam, the Netherlands, to discuss the latest innovations and research on myopia management. Select presentations from the Topcon Healthcare symposium at the IMC have been chosen for summarization. In the debut article in this series published in the January/February 2023 issue, Prof. Joan Pérez Corral reviewed how MYAH data (Topcon Healthcare) guided his decision-making in orthokeratology.
In this installment of the series, Dr. Liandra Jung discusses the use of MYAH’s growth curves to estimate patient risk of myopia and explores how eye care providers can navigate confounding factors to growth curve utility. A video of her presentation can be found by scanning the QR code on the next page.
Look for the third and final installment updating readers about the findings discussed at the 18th IMC in this issue of Cataract & Refractive Surgery Today and Modern Optometry.
Early detection of myopia may be key to targeted and effective intervention in pediatric patients. Growth curves are an important tool in this endeavor. Generation of reliable growth curves requires aggregation of data on emmetropic eyes and tracking of prenatal and early postnatal growth patterns. Confounding factors such as race/ethnicity, gender, and cohort effects raise questions about growth curves’ utility (eg, “If my patient is an Asian girl born in 2023, how applicable is a growth curve generated from data starting in 2005 from European infants”). Real-world examples of growth curve application illustrate how we can best navigate these concerns.
PRENATAL AND EARLY POSTNATAL GROWTH DYNAMICS
Tideman et al, in a 2019 publication, measured the axial length and corneal radius of curvature of the eyes in prenatal and postnatal patients at the second trimester, third trimester, at birth, and until month 72.1 The authors found that larger newborns had a longer axial lengths and flatter corneas compared with other patients. Greater weight and height from the second trimester to month 24 were linked with longer axial length, but this association started to fade beyond 2 years postnatal, suggesting that increased exposure to the outside world may lessen the effects of genetic factors linked to ocular growth.
Other researchers have examined older children. In 2019, Rozema et al published findings on the examination of the axial length and lens power loss of the eyes of school-aged children in Singapore (Figure 1).2 The authors found that earlier myopia onset was linked with faster progression, greater mean lens power loss, and longer axial length. These researchers used an axial length of 23.85 mm as the point of myopia onset. Clinically, we might consider flagging emmetropic children whose axial length is trending toward 23.70 mm for more frequent monitoring.
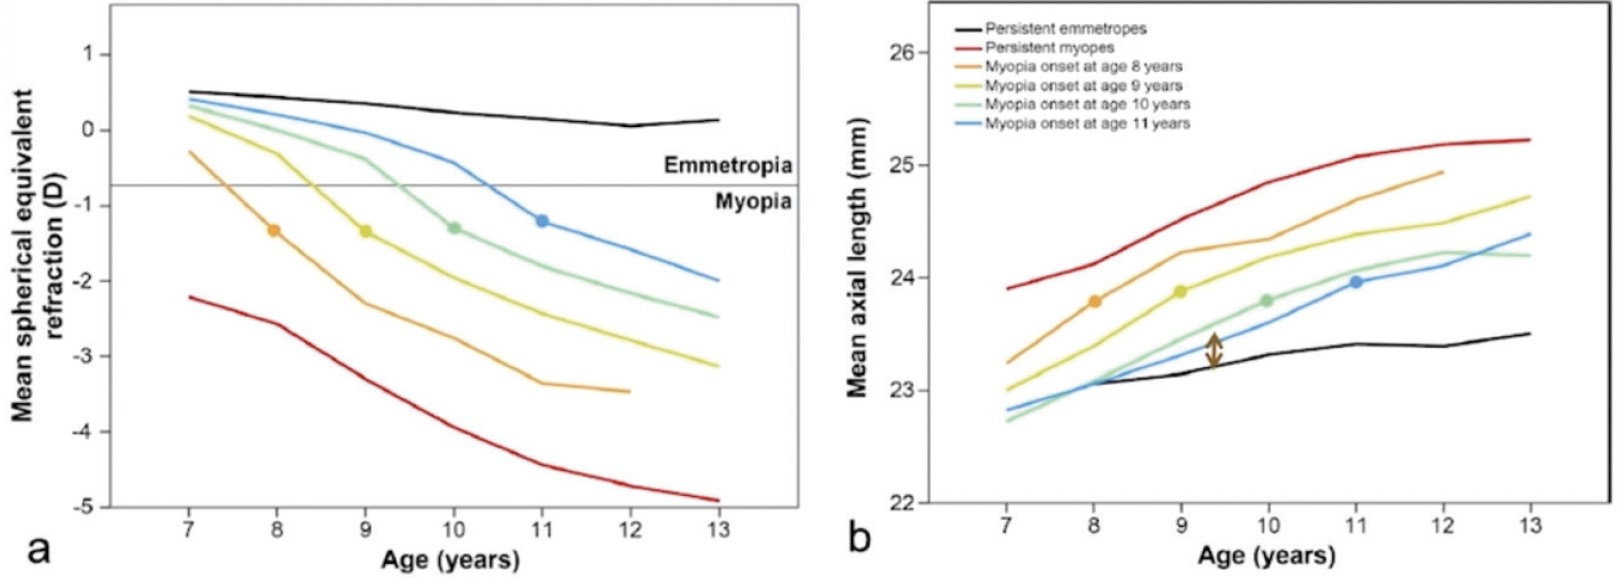
Figure 1. These graphs show the mean spherical equivalent (left graph) and mean axial length (right graph) of Singaporean school children, as divided by age of myopia onset. The group with the youngest age of myopia onset (ie, 8 years) showed the greatest refractive error and the longest mean axial length. The dot on the age-related lines show the point of myopia onset.2
CONFOUNDING FACTORS IN GROWTH CURVE INTERPRETATION
Gender, ethnicity, and cohort effects are three confounding factors that complicate the interpretation of growth curves. Females generally have shorter axial lengths, steeper corneas, and more myopic refractive error compared with males. Hypotheses for this phenomenon include biologic, environmental, and social factors.
Regarding ethnicity, Asian children tend to have earlier-onset myopia, faster myopic progression, and later stabilization. This population has similar axial lengths at birth compared to other racial/ethnic populations, suggesting that a congenital dynamic (eg, larger eyes at birth) is unrelated to this observation.
Cohort effects refer to the impact of unique circumstances experienced by a group of people and the outcomes they exhibit. This means that a population’s living conditions and environment can be associated with specific results. For example, the axial lengths of the eyes of children from the 1980s may be different from those of an age-matched cohort from the 2020s due to the latter era’s ubiquity of small-screen devices, and now, the impact of the COVID-19 pandemic.
REAL-WORLD CASES
Real-world cases illustrate the value of growth curves and the challenges of using them in patients whose demographics misalign with the cohort used to generate the curves. In both cases below, patients were examined using MYAH (Topcon Healthcare), an all-in-one optical biometer, corneal topographer, and pupillometer. Growth curves used by MYAH are an augmented version of the curves published by Erasmus University in 2018, reflecting a European cohort, and are available for males and females.3
Axial length measurements captured during the examination are charted on the MYAH growth curves, allowing real-time assessment of patient risk for developing myopia and high myopia. Longitudinal data graphing enables clinicians to estimate the results of myopia management techniques in patients who have undergone intervention.
A 9-year-old white male presented to the clinic with myopia and an axial length of 24.2 mm (Figure 2). Using growth curves on the MYAH, this placed him in the 90th percentile for his age. His risks of developing myopia and high myopia were, respectively, 87% and 8%. At age 10, myopia control was implemented, and the patient adhered to a schedule of regular follow-up visits. By the time the patient was 13, his axial length measurements were less than those predicted by the growth curve, thereby allowing us to estimate the effect of intervention. It should be noted that this patient’s demographics were similar to those used in creation of the growth curves. This means that the patient’s risk as calculated by the growth curve was likely similar to any adjusted risk that accounted for demographic details.
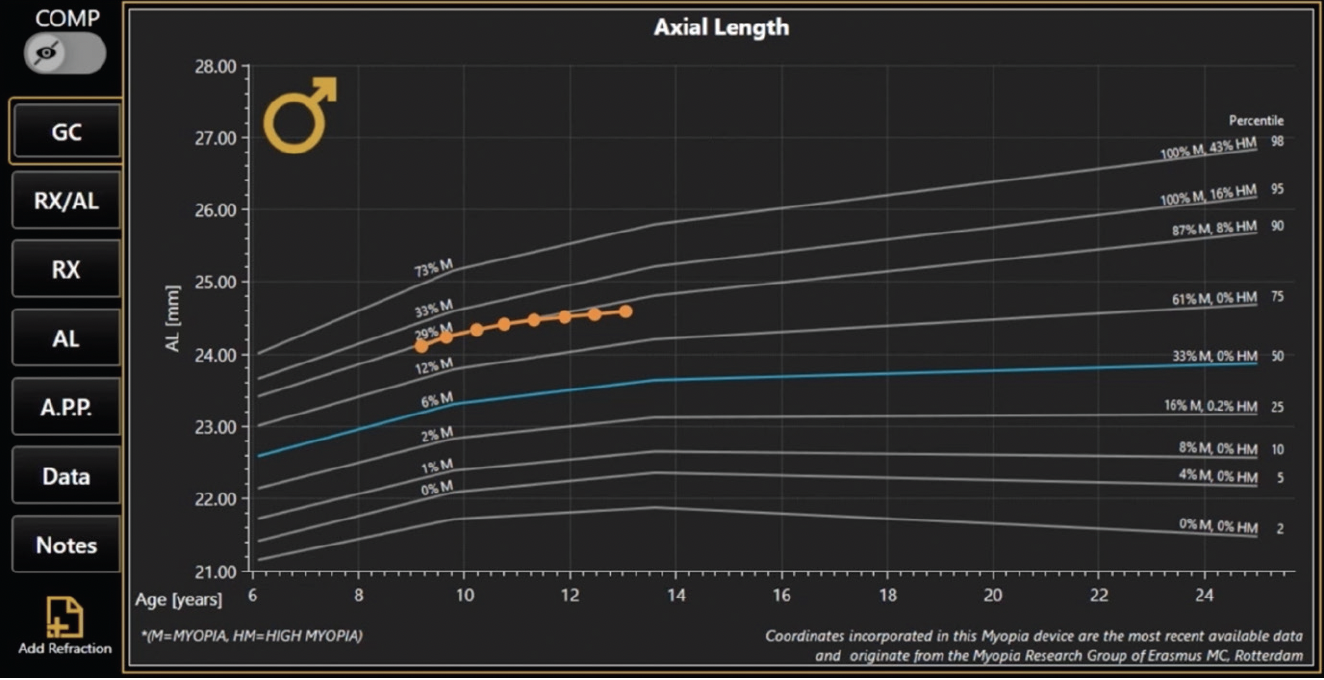
Figure 2. The growth curve (orange line) of a 13-year-old white male who presented at age 9. His axial length measurements placed him in the 90th percentile range, which correlated to an 87% chance of developing myopia and an 8% chance of developing high myopia. (Percentile and risk percentages can be seen on the right side of the figure.) By age 13, medical intervention resulted in the patient’s axial length falling beneath the percentile he originally aligned with.
A 6-year-old Asian female whose parents are both myopic presented to the clinic to assess her risk of myopia (Figure 3). Axial length was measured at 23.4 mm on her first visit, placing her in the 98th percentile for her age. During the evaluation, I noted that her demographic features (ie, female gender, Asian ethnicity) did not align with those patients used to generate these growth charts (ie, European). Given that Asian ethnicity places a patient at higher risk of myopia, I estimated that her risk of developing myopia was higher than the 98% risk denoted in the growth curve. Sure enough, follow-up visits indicated that her axial length was rapidly increasing beyond that predicted by the growth curve.
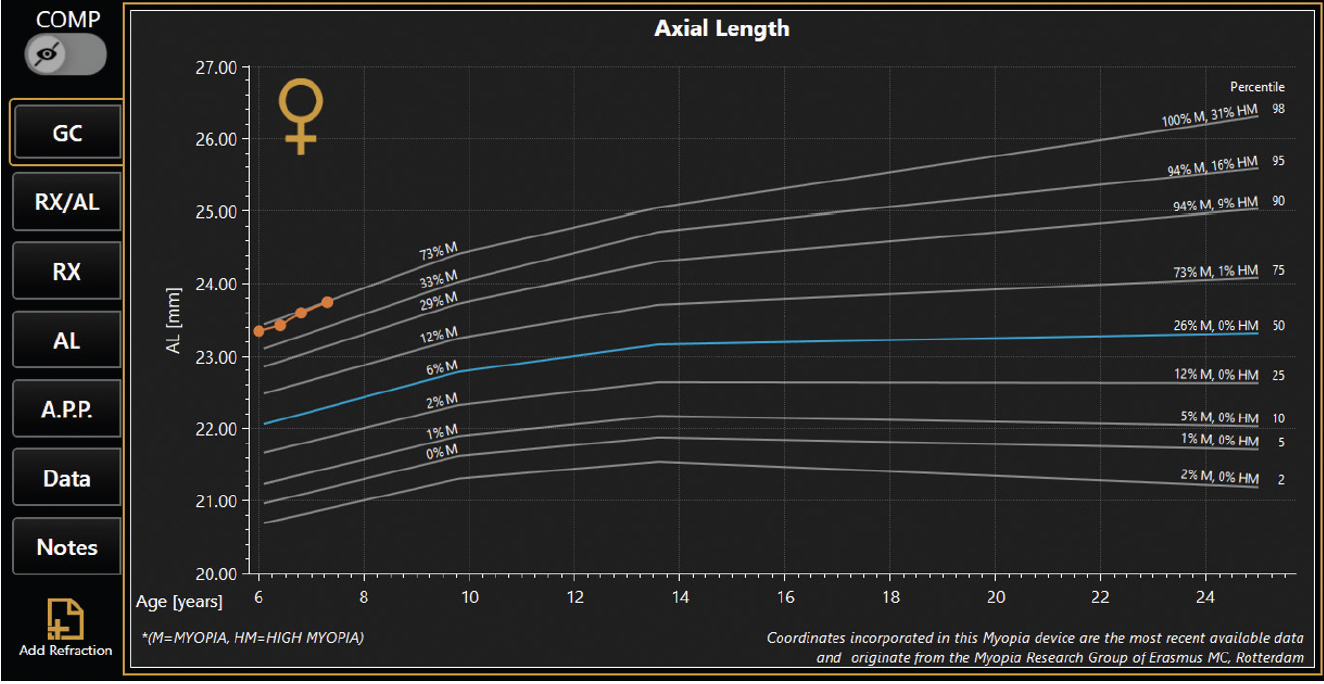
Figure 3. A 6-year-old Asian female presented for an evaluation of myopia risk; both of her parents are myopic. Initial evaluation showed that she fit into the 98th percentile according to the growth curve. After considering her ethnicity, it was determined that she may be at a risk that is higher than that suggested by the initial growth curve estimate.
TAKE-HOME POINTS
Growth curves are powerful tools that can be used to assess patients’ risk of myopia. Visualizing your patient’s axial length on a growth curve on MYAH’s interface allows clinicians to make quick and accurate assessments of risk and illustrate the effects of myopia-control methods. Eye care providers must account for confounding factors such as gender, race, time indoors, and cohort effects when using growth curves to estimate myopia risk. Perhaps future growth curves will aim for demographic variety that better reflect our patients’ characteristics, thereby improving our ability to prognosticate myopia.
Watch it Now
Dr. Jung shares two real-world cases that illustrate the utility of growth curves on MYAH (Topcon Healthcare).
1. Tideman JWL, Polling JR, Jaddoe VWV, et al. Growth in foetal life, infancy, and early childhood and the association with ocular biometry. Ophthalmic Physiol Opt. 2019;39(4):245-252.
2. Rozema J, Dankert S, Iribarren R, et al. Axial growth and lens power loss at myopia onset in Singaporean children. Invest Ophthalmol Vis Sci. 2019;60(8):3091-3099.
3. Tideman JWL, Polling JR, Vingerling JR, et al. Axial length growth and the risk of developing myopia in European children. Acta Ophthalmol. 2018;96(3):301-309.

