


Blur, clinically, is when a patient has a residual refraction of more than 0.50 D spherical equivalent plus cylinder after cataract surgery or refractive lens exchange. That means, to avoid blur, the patient can have 0.25 D spherical equivalent and 0.25 D cylinder, or 0.50 D of either one, but not 0.50 D of both. It has to add up to less than 0.50 D. The following five pearls will help you to meet that target and provide your patients with the visual improvement they are looking for.
AT A GLANCE
- To prevent blur after cataract surgery, residual spherical equivalent plus cylinder must be less than 0.50 D. The author provides five pearls to help surgeons meet that target.
- Looking at several less commonly used topography measurements can improve your refractive results. The author explains where to find them and how to put them to use.
- All surgeons should be using modern IOL power calculation formulas that incorporate multiple variables.
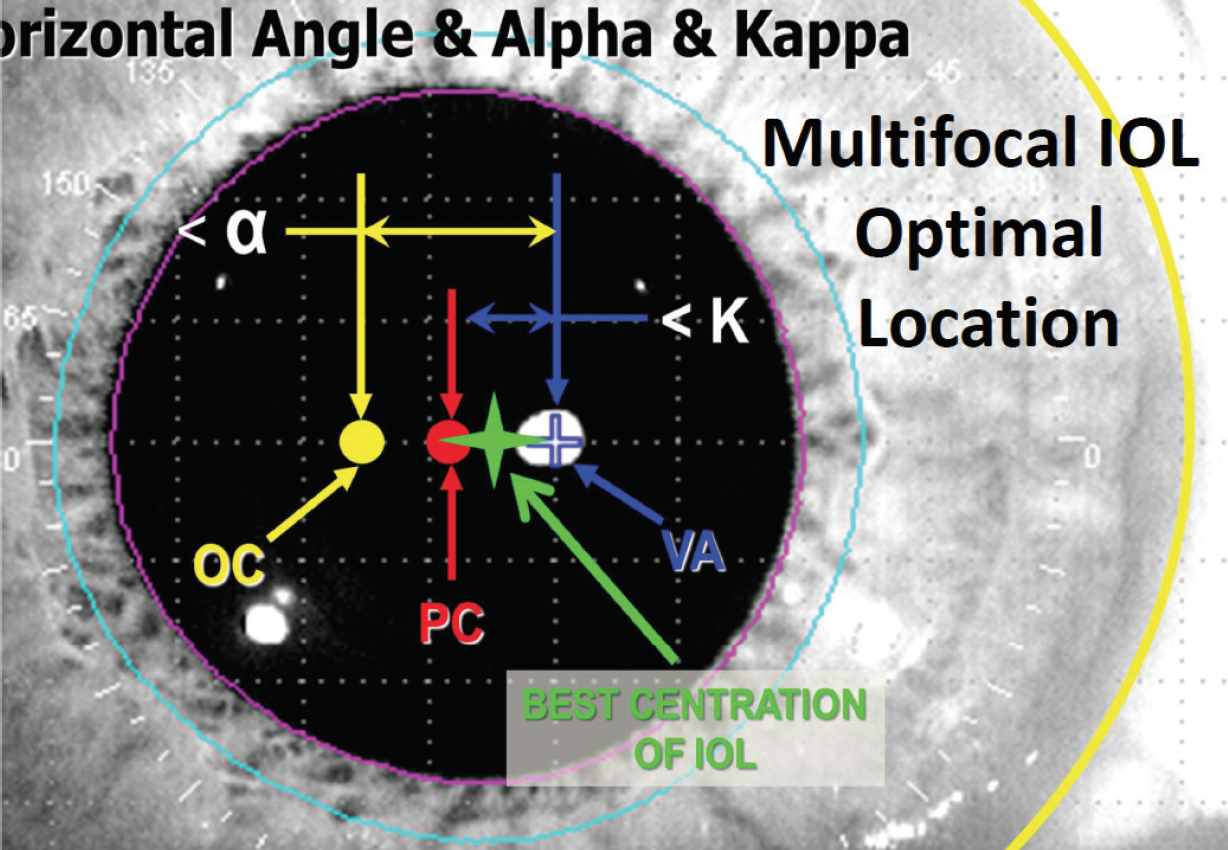
Figure 1. The best place to center a premium IOL is halfway between the visual axis (VA; in blue) and the pupil center (PC; in red).
Pay attention to the angle kappa
The proper place to center a diffractive, premium, aspheric, or toric IOL is halfway between the visual axis and the center of the pupil (Figure 1). The dimension between the visual axis and the pupil is called the angle kappa (or chord mu, more recently). If that value is greater than 0.6 mm, patients with diffractive lenses will have halos and glare. You can find this value on the printout from your optical biometer at the bottom of page 2, which you may never have seen because technicians tend to throw that page away. Figure 2 shows a printout from the Lenstar (Haag-Streit), and Figure 3 shows one from the IOL Master (Carl Zeiss Meditec).
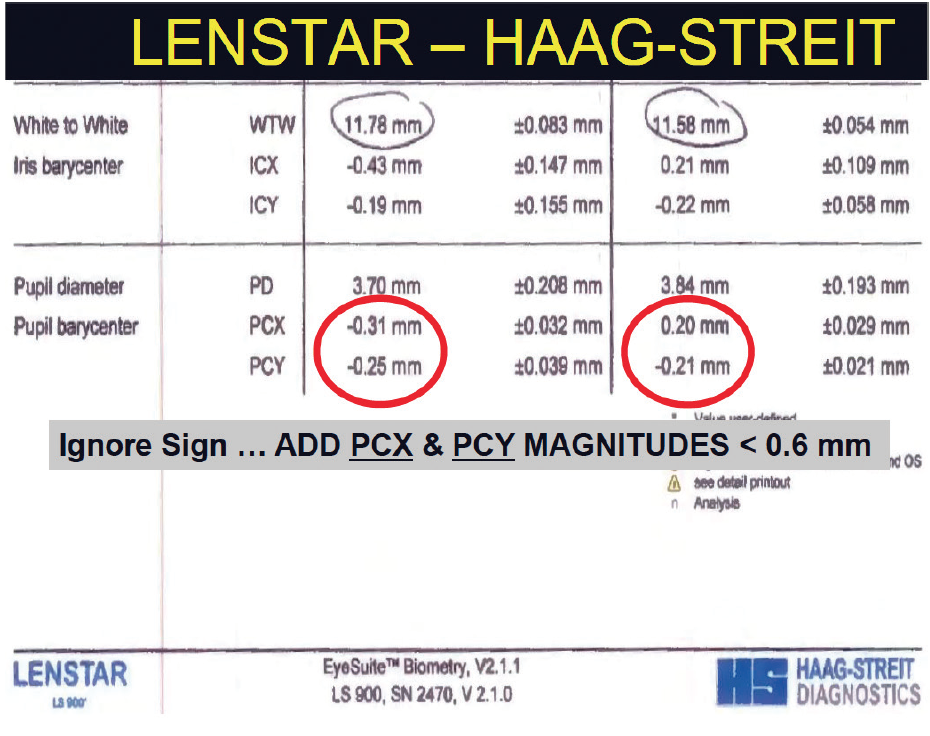
Figure 2. Page 2 printout from the Lenstar LS 900.
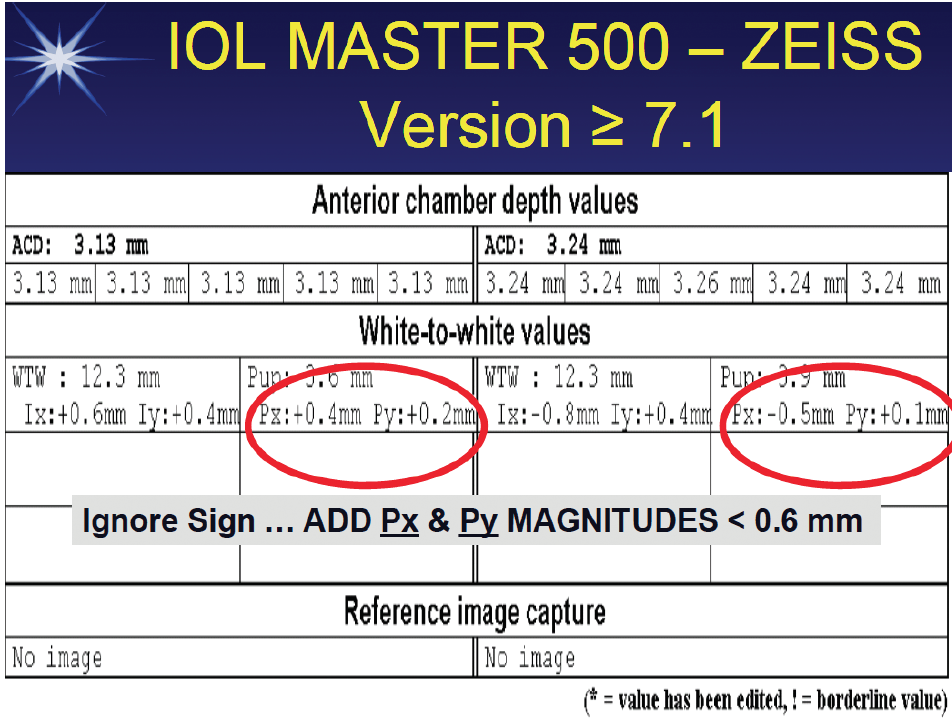
Figure 3. Page 2 printout from the IOL Master 500.
Refer to the standard deviation of the keratometry
Another metric on the IOL Master or Lenstar that you may not have looked at is the standard deviation of the keratometry (K). If that value greater than 0.20 D, the patient has irregular astigmatism and is going to have a refractive surprise because the K readings are wrong. Now, the reason that most people don’t look at this value is that it is indicated in millimeters on the IOL Master (Figure 4) or microns on the Lenstar (Figure 5). A standard deviation of 0.20 D would be expressed as 30 µm or 0.03 mm. If the standard deviation is greater than that, get a topography reading.
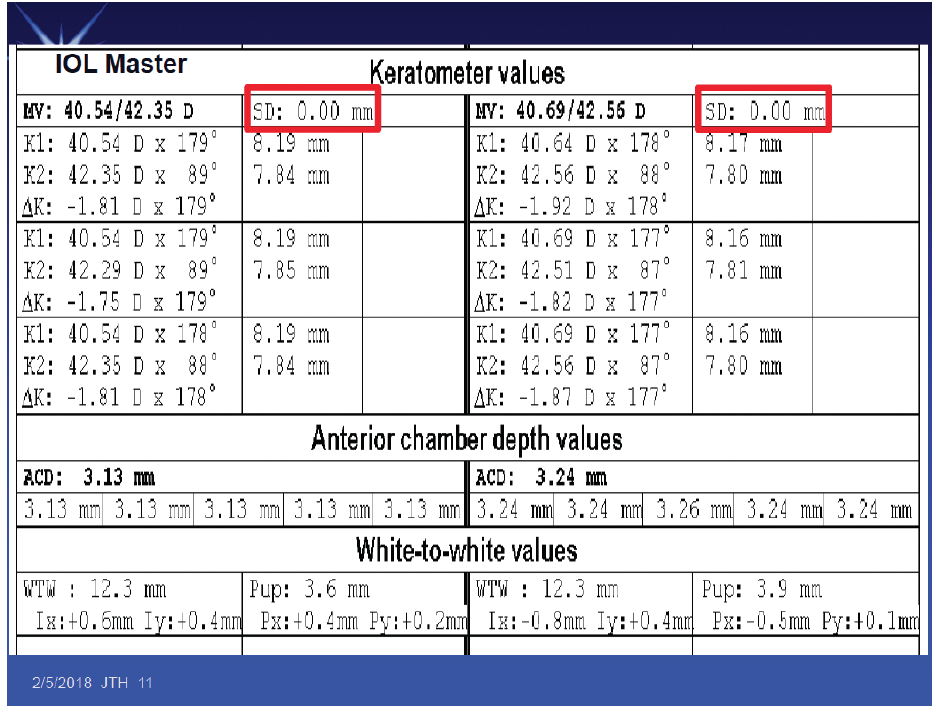
Figure 4. The standard deviation of K on the IOL Master (boxed in red).
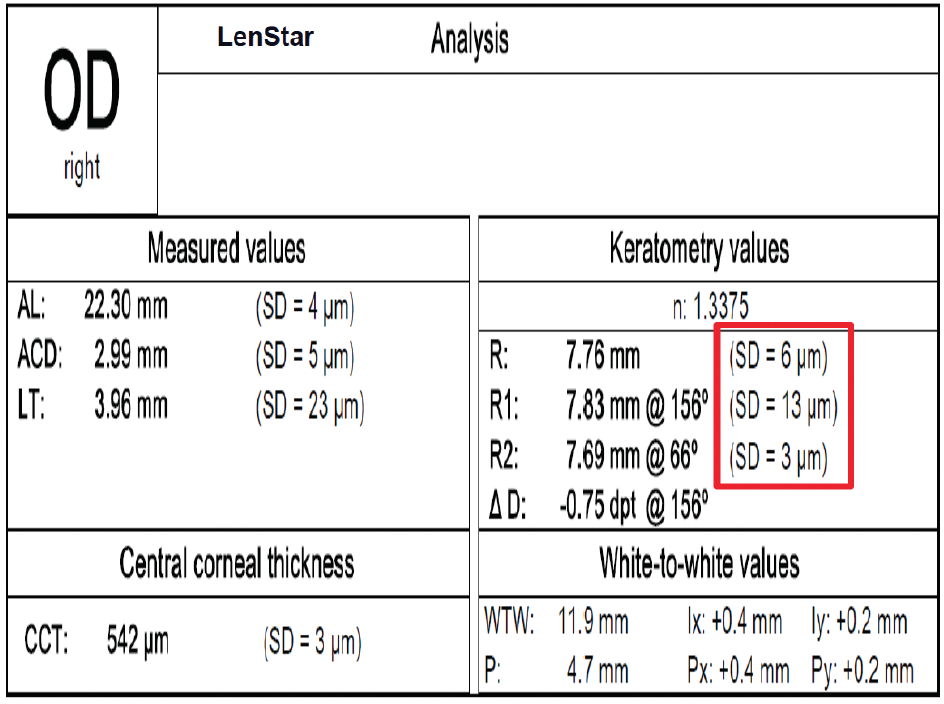
Figure 5. The standard deviation of K on the Lenstar (boxed in red).
Look at the higher-order root mean square corneal wavefront error over a 6-mm zone
Every topographer provides a Zernike analysis with higher-order root mean square (RMS) corneal wavefront error over a 6-mm zone. That value tells you the optical quality of the cornea. It takes everything into account that can’t be corrected with sphere or cylinder. The value is 0.38 µm in a normal cornea. In people who have had refractive surgery and are happy and don’t experience halos and glare, it is 0.58 µm, and in people who report halos and glare, it’s about 1.31 µm. If you put a diffractive IOL in someone with a measurement greater than 1.00 µm, you will reduce the contrast sensitivity further and he or she will not be happy with the results.
This value, which will tell you whether or not a patient will have problems with halos and glare, is available on all topographers, but it is hidden back among some settings. The entire Zernike tree is shown in Figure 6, with the single value for higher-order RMS corneal wavefront error over a 6-mm zone highlighted in a red box. This figure alone can be displayed without having to look at the entire tree on any topographer.
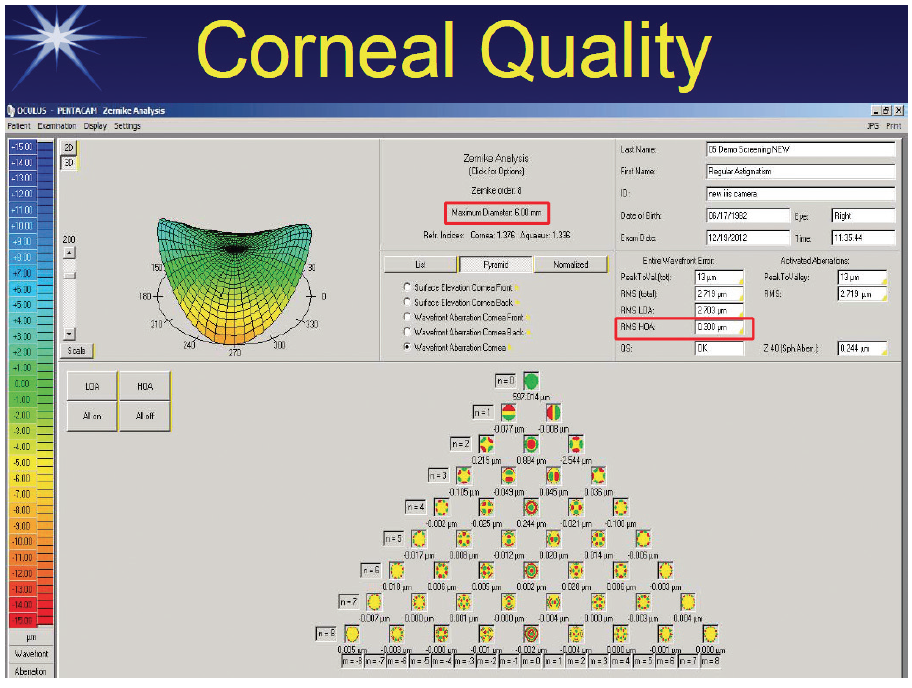
Figure 6. The entire Zernike tree on the Pentacam (Oculus Optikgeräte), with the single value for higher-order RMS corneal wavefront error over a 6-mm zone boxed in red.
Screen the Measurements
There are five screening parameters that your technician can identify to let you know that a patient’s measurements are abnormal. The first three in the list on the following page are binocular differences and the last two are monocular red flags:
No. 1. More than 0.3 mm difference between eyes in axial length;
No. 2. 1.00 D difference between eyes in average Ks;
No. 3. 1.00 D difference between eyes in IOL power;
No. 4. If an optical biometer’s signal-to-noise ratio is less than 2, don’t trust the axial length. Likewise, question the results if the K reading standard deviation is greater than 0.20 D (0.03 mm/30 µm); and
No. 5. In eyes that are more than 25 mm long, the biometer measures the wrong axial length. The eye is too long, and this increases the chance of a hyperopic surprise. One solution is to use a nonlinear regression formula in those cases to adjust for the axial length.
You can improve the percentage of people achieving less than 0.50 D of blur by 2% to 3% just by personalizing your own lens constant. This can be achieved by asking the technicians to input your postoperative values.
Choose your formula wisely
Everyone should be using the Holladay II, the Olsen II, or the Barrett II formulas. These all use multiple variables, and they get better results because they better predict effective lens position. Bausch + Lomb’s and Alcon’s normal online toric calculators use a constant ratio of 1.46 between the astigmatism of the cornea and the toric IOL cylinder power; however, that’s only accurate for a 22.00 D lens. It underestimates the toricity for a low power and overestimates it for a high power. You should use a calculator that doesn’t use a constant ratio to get the best result, such as the Johnson & Johnson Vision or Holladay toric calculator (open access at www.hicsoap.com).
